Lista CMA y CDS soberanos que más suben y bajan en el día

Highest Default Probabilities
Entity Name Mid Spread CPD (%)
Greece8757.0093.21
Cyprus1439.9970.74
Argentina1433.3963.03
Portugal1162.3362.47
Venezuela956.2049.46
Pakistan961.7349.02
Ireland717.5345.81
Ukraine878.6345.24
Illinois/State of243.8740.06
Spain585.1139.46
Sovereign Tighteners
Entity Name 5 Yr Mid Change (%) Change (bps) CPD (%)
Korea, Republic of138.16-4.27-6.1611.33
United Kingdom of Great Britain and Northern Ireland72.84-2.47-1.846.18
China132.95-1.79-2.4310.94
Austria190.71-1.69-3.2915.23
Philippines196.12-1.64-3.2715.73
Latvia, Republic of324.62-1.63-5.3820.04
Turkey282.86-1.58-4.5517.77
Sweden68.31-1.58-1.105.72
<>
<>
Sovereign Wideners
Entity Name 5 Yr Mid Change (%) Change (bps) CPD (%)
New Zealand
100.50
+2.09
+2.06
8.37
Chile
125.13
+1.88
+2.31
8.30
Vietnam
366.90
+1.07
+3.89
27.22
Bahrain
364.37
+0.72
+2.60
22.15
Croatia
557.56
+0.72
+3.97
31.89
United States of America
48.75
+0.60
+0.29
4.12
Denmark
132.75
+0.57
+0.76
10.79
Ukraine
878.63
+0.49
+4.31
45.24

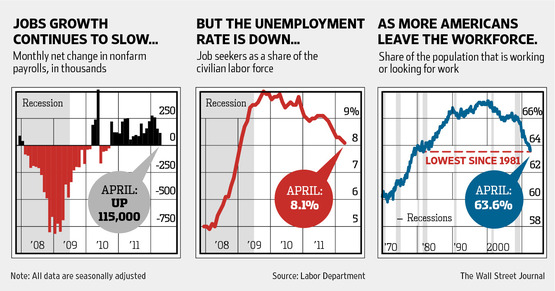
Dato de empleo USA: resultados en 2012 y previsiones para Mayo


2012 Monthly Payroll Jobs Added (000s)
Total nonfarmPrivatePublicUnemployment Rate
January275277-28.3%
February25925458.3%
March154166-128.2%
April115130-158.1%
May15011601-1018.1%1
1Consensus forecast for May from Bloomberg.

Toneladas de oro de los EUA y principales poseedores europeos

World Official Gold Holdings as at May 2012
COUNTRYTONNES HELD
United States8,133.5
Germany3,396.3
Italy2,451.8
France2,435.4
Switzerland1,040.1
Netherlands612.5
E.C.B.502.1
Portugal382.5
Spain281.6
Austria280.0
Greece111.7

Lista CMA y CDS soberanos que más suben y bajan en el día

<>
Highest Default Probabilities
Entity Name Mid Spread CPD (%)
Greece
8675.60
93.12
Cyprus
1385.55
69.44
Portugal
1187.28
63.29
Argentina
1300.00
60.30
Venezuela
947.04
49.27
Pakistan
958.24
49.03
Ireland
705.02
45.32
Ukraine
845.20
44.08
Illinois/State of
237.60
39.40
Spain
536.48
36.98
Sovereign Tighteners
Entity Name 5 Yr Mid Change (%) Change (bps) CPD (%)
France203.66-4.69-10.0116.15
Austria182.32-3.32-6.2514.67
Japan104.15-2.21-2.358.06
Denmark129.04-2.18-2.8810.56
Belgium270.00-2.04-5.6320.85
Finland85.77-1.97-1.737.14
Portugal1187.28-1.89-22.8163.29
Chile117.80-1.72-2.067.87
<>
<>
Sovereign Wideners
Entity Name 5 Yr Mid Change (%) Change (bps) CPD (%)
Indonesia
243.97
+9.53
+21.22
19.24
Vietnam
369.32
+2.96
+10.61
27.50
Philippines
201.31
+2.28
+4.49
16.18
Kazakhstan
266.28
+2.21
+5.75
16.86
Turkey
279.62
+2.15
+5.87
17.64
Russia
249.60
+1.93
+4.73
15.93
Poland
270.60
+1.55
+4.13
17.15
Lebanon
497.08
+1.37
+6.73
29.03

Lista CMA y CDS soberanos que más suben y bajan hoy

<>
Highest Default Probabilities
Entity Name Mid Spread CPD (%)
Greece
8472.90
92.83
Cyprus
1414.86
70.23
Portugal
1227.10
64.58
Argentina
1225.25
58.13
Pakistan
943.84
48.52
Venezuela
911.25
47.96
Ireland
720.40
46.06
Ukraine
848.04
44.21
Illinois/State of
237.83
39.45
Spain
543.87
37.41
Sovereign Tighteners
Entity Name 5 Yr Mid Change (%) Change (bps) CPD (%)
Japan106.20-2.33-2.538.22
Lebanon493.19-1.15-5.7328.85
Bahrain355.83-0.92-3.3121.77
United Kingdom of Great Britain and Northern Ireland72.50-0.52-0.386.17
Kingdom of Saudi Arabia131.25-0.50-0.658.66
Indonesia220.00-0.44-0.9717.53
Austria193.22-0.42-0.8215.49
United Mexican States145.00-0.34-0.509.58
<>
<>
Sovereign Wideners
Entity Name 5 Yr Mid Change (%) Change (bps) CPD (%)
Netherlands
129.15
+4.72
+5.82
10.59
Romania
450.00
+2.99
+13.04
26.77
Finland
88.01
+2.78
+2.38
7.33
Slovakia
285.00
+2.72
+7.54
17.92
New Zealand
103.50
+2.58
+2.61
8.64
United States of America
48.74
+2.36
+1.12
4.16
Australia
91.41
+2.02
+1.81
7.68
Bulgaria
358.08
+1.88
+6.60
21.98

Lista CMA y CDS soberanos que más suben y bajan hoy

Curiosamente, sólo los CDS de Panamá y por muy pocos, están hoy en positivo en el mundo. Hasta tal punto es el contagio de la crisis europea.
Highest Default Probabilities
Entity Name Mid Spread CPD (%)
Greece6943.4090.19
Cyprus1318.0367.80
Portugal1135.9861.97
Argentina1112.0755.08
Venezuela950.8349.61
Pakistan957.4749.25
Ukraine838.9544.01
Ireland666.9643.68
Illinois/State of228.9338.43
Spain544.7737.58
Sovereign Tighteners
Entity Name 5 Yr Mid Change (%) Change (bps) CPD (%)
Panama137.21-0.30-0.429.12
<>
<>
Sovereign Wideners
Entity Name 5 Yr Mid Change (%) Change (bps) CPD (%)
Czech Republic
135.47
+8.17
+10.23
9.02
Cyprus
1318.03
+6.61
+81.70
67.80
Norway
27.69
+6.28
+1.64
2.39
New Zealand
101.50
+5.88
+5.64
8.52
Kazakhstan
263.39
+5.84
+14.54
16.81
Bulgaria
352.02
+5.62
+18.73
21.73
Romania
415.72
+5.49
+21.63
25.11
Vietnam
360.00
+5.34
+18.26
27.03

Precios de la gasolina en el mundo

Está en $ por galón (estilo norteamericano) pero sirve como referencia. Os dejo el link del gráfico http://www.ritholtz.com/blog/wp-content/uploads/2012/05/Highest-and-Cheapest-Gas-Prices-by-Country.png pero como me parece muy poco claro os pego la lista:
Most expensive gas ranking:Price per gallon of premium gasoline: 
Norway$9.69
Denmark$9.37
Italy$9.35
Netherland$9.35
Greece$9.23
Sweden$8.97
Hong Kong$8.89
Portugal$8.85
United Kingdom$8.84
Belgium$8.82
France$8.72
Finland$8.59
Germany$8.56
Ireland$8.34
Switzerland$7.95
Slovakia$7.93
Hungary$7.69
Czech Republic$7.59
Japan$7.58
South Korea$7.57
Spain$7.55
Slovenia$7.54
Austria$7.45
Malta$7.32
Latvia$7.26
Luxembourg$7.24
Lithuania$7.24
Estonia$7.05
Poland$7.01
Cyprus$7.00
Bulgaria$6.94
Australia$6.75
Singapore$6.70
Romania$6.59
Chile$6.54
Brazil$6.41
India$6.06
Canada$5.75
South Africa$5.72
Seychelles$5.53
Argentina$5.44
China$5.31
Thailand$4.96
United States$4.19
Indonesia$4.11
Russia$3.71
Malaysia$3.30
Mexico$3.20
Iran$2.78
Nigeria$2.33
United Arab Emirates$1.89
Egypt$1.73
Kuwait$0.88
Saudi Arabia$0.61
Venezuela$0.09

http://www.bloomberg.com/slideshow/2012-05-12/highest-cheapest-gas-prices-by-country.html#slide1

Récord de los CDS de España y lista CMA

<>
Highest Default Probabilities
Entity Name Mid Spread CPD (%)
Greece
5903.60
87.63
Cyprus
1143.25
62.72
Portugal
1102.71
61.03
Argentina
990.00
51.00
Pakistan
857.76
45.63
Venezuela
770.00
42.60
Ukraine
797.57
42.49
Ireland
595.83
40.12
Illinois/State of
222.99
37.73
Spain
520.65
36.35
Sovereign Tighteners
Entity Name 5 Yr Mid Change (%) Change (bps) CPD (%)
United States of America40.50-3.57-1.503.50
Japan99.10-2.71-2.767.74
Morocco242.75-2.60-6.4915.54
Korea, Republic of128.32-1.20-1.5610.71
Kingdom of Saudi Arabia120.05-1.20-1.458.01
Abu Dhabi/Emirate of121.50-0.82-1.008.13
Malaysia121.11-0.70-0.8610.14
Vietnam321.16-0.67-2.1724.57
<>
<>
Sovereign Wideners
Entity Name 5 Yr Mid Change (%) Change (bps) CPD (%)
New Zealand
94.02
+6.19
+5.48
7.94
United Kingdom of Great Britain and Northern Ireland
70.00
+2.49
+1.70
6.03
Australia
83.91
+1.63
+1.34
7.12
Norway
26.00
+1.57
+0.40
2.25
France
212.67
+1.51
+3.17
16.92
Croatia
460.81
+1.33
+6.06
27.46
Finland
84.17
+1.25
+1.04
7.07
Cyprus
1143.25
+1.00
+11.34
62.72

Algunos datos del Ibex

según Bloomberg

España vuelve al "top ten" de la lista CMA

<>
Highest Default Probabilities
Entity Name Mid Spread CPD (%)
Greece
5730.10
87.52
Cyprus
1125.00
62.22
Portugal
1070.26
60.09
Argentina
956.78
49.85
Pakistan
825.32
44.33
Venezuela
740.48
41.39
Ukraine
768.22
41.35
Ireland
585.30
39.64
Illinois/State of
222.09
37.66
Spain
495.00
35.00
Sovereign Tighteners
Entity Name 5 Yr Mid Change (%) Change (bps) CPD (%)
Netherlands121.08-1.56-1.9210.03
Denmark126.12-0.69-0.8810.43
New Zealand85.10-0.47-0.407.22
Norway25.94-0.24-0.062.25
Philippines157.21-0.08-0.1212.98
Malaysia113.86-0.02-0.039.59
Thailand135.92-0.02-0.0311.32
Australia79.40-0.01-0.016.76
<>
<>
Sovereign Wideners
Entity Name 5 Yr Mid Change (%) Change (bps) CPD (%)
France
197.50
+2.74
+5.27
15.84
Chile
95.05
+2.21
+2.05
6.45
Spain
495.00
+1.71
+8.33
35.00
Ireland
585.30
+1.68
+9.65
39.64
Finland
81.83
+1.66
+1.33
6.89
Austria
170.17
+1.59
+2.67
13.91
Japan
99.69
+1.14
+1.13
7.79
Argentina
956.78
+1.04
+9.88
49.85

Y yo me pregunto...


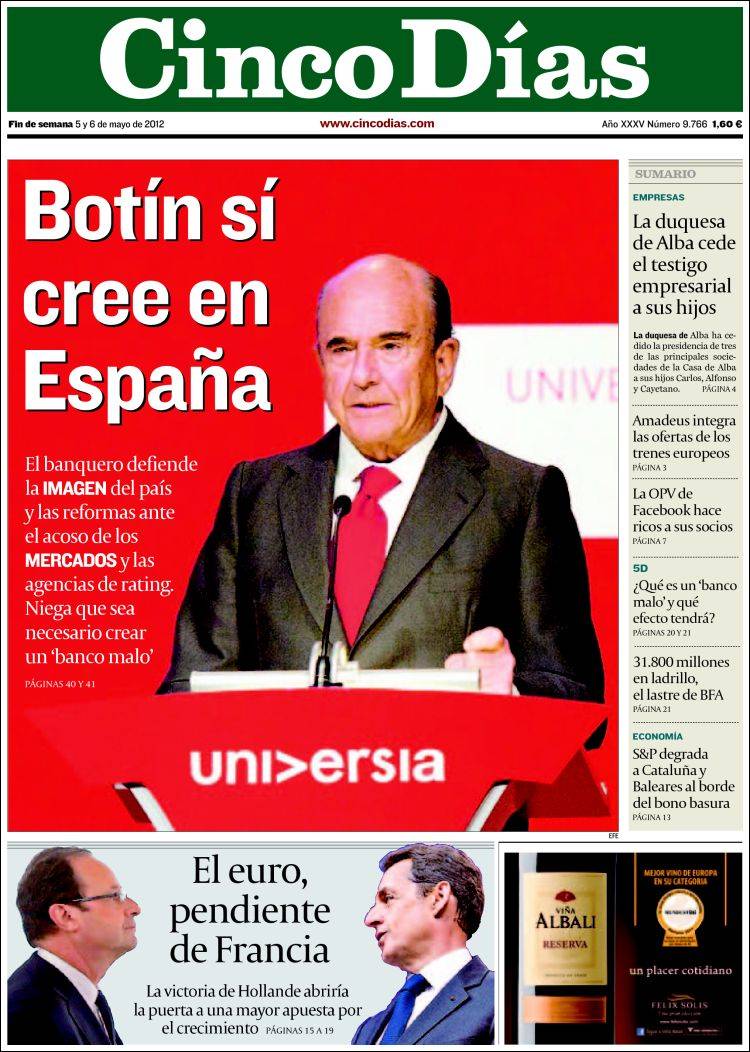
  ¿Podría haber alguna relación entre la complicadísima situación económica del Grupo Prisa que necesita imperiosamente de la banca para ganar tiempo y refinanciar -una vez más- sus deudas y esta portada del 5 Días con un mensaje tan groseramente publicitario?
¿O soy muy malpensado y hay motivos para creer que el principal banquero de España se merece esa portada? Que yo sepa desde que empezó la crisis financiera ha aumentado sus inversiones fuera de nuestras fronteras y las ha reducido en España. De hecho, es la única entidad financiera "sana" que aún no ha participado en la reorganización del sistema financiero español. Además, hace pocos días avisó que no pensaba comprar más deuda española y reconoció que la inmensa mayoría de lo que tomó de BCE en la última LTRO lo está depositando en el mismo BCE lo que significa que no está destinando esa liquidez a la economía real.
Por supuesto, su banco es muy libre de hacer lo que considere más oportuno para sus intereses y entiendo que el señor Botín busque el máximo beneficio para sus accionistas ya que son los que le mantienen en el puesto pero entonces, ¿A qué viene esta imagen de filántropo patriota que nos ofrece esta portada?
Y puedo ser más comprensivo con la falta de objetividad de este periódico si con ello obtiene el crédito que necesita -porque de la situación financiera del Grupo Prisa dependen los sueldos de muchos trabajadores-  que con otros medios que lo hacen por politiqueo pero dadas las últimas noticias que se han publicado sobre la remuneración de los consejeros de una compañía que lleva meses en quiebra técnica por la mala gestión de esos mismos dirigentes, no parece que esta supuesta  falta de profesionalidad se haya perpretado para salvar a los trabajadores precisamente.
Claro, que a lo mejor estoy yo equivocado y realmente Botín sí cree -dando por hecho que otros no- en España, defiende la imagen del país (eso sí, no aumentando su inversión en él cuando más lo necesita) contra el acoso de los mercados (como si Banco Santander no fuera parte importante de esos mismos mercados) y de las malísimas agencias de ráting (ahora que rebajan rátings, cuando los subían él presumía).

Lista CMA y CDS soberanos que más suben y bajan en el día

<>
Highest Default Probabilities
Entity Name Mid Spread CPD (%)
Greece
5730.10
87.51
Cyprus
1113.31
61.85
Portugal
1007.59
57.91
Argentina
930.00
48.93
Pakistan
807.00
43.68
Ukraine
760.96
41.15
Venezuela
685.00
39.04
Ireland
561.47
38.41
Illinois/State of
221.59
37.67
Egypt
613.55
34.83
Sovereign Tighteners
Entity Name 5 Yr Mid Change (%) Change (bps) CPD (%)
Belgium236.49-3.82-9.3918.72
Lithuania233.51-2.18-5.1915.10
Germany83.59-1.65-1.417.09
Latvia, Republic of240.57-1.58-3.8615.49
Austria164.75-1.53-2.5513.50
France188.02-1.37-2.6115.15
Sweden58.31-1.17-0.694.97
Finland78.58-1.04-0.836.64
<>
<>
Sovereign Wideners
Entity Name 5 Yr Mid Change (%) Change (bps) CPD (%)
Portugal
1007.59
+5.28
+50.52
57.91
United States of America
40.49
+4.92
+1.90
3.51
Norway
25.50
+1.99
+0.50
2.22
Bahrain
365.00
+1.39
+5.00
22.48
New Zealand
83.50
+0.94
+0.78
7.11
Qatar
120.70
+0.90
+1.08
8.13
Egypt
613.55
+0.58
+3.55
34.83
Japan
95.00
+0.58
+0.55
7.46

Tenencia de ORO de cada país en toneladas

WORLD OFFICIAL GOLD HOLDINGS
International Financial Statistics, April 2012*
TonneladasToneladas
1United States8,133.551Brazil33.6
2Germany3,396.352Slovakia31.8
3IMF2,814.153Ukraine28.0
4Italy2,451.854Ecuador26.3
5France2,435.455Syria25.8
6China1,054.156Morocco22.0
7Switzerland1,040.157Nigeria21.4
8Russia879.258Serbia14.3
9Japan765.259Cyprus13.9
10Netherlands612.560Bangladesh13.5
11India557.761Jordan12.8
12ECB502.162Cambodia12.4
13Taiwan422.463Qatar12.4
14Portugal382.564Czech Republic12.4
15Venezuela365.865Colombia10.4
16Saudi Arabia322.966Sri Lanka9.7
17United Kingdom310.367Laos8.9
18Lebanon286.868Latvia7.7
19Spain281.669El Salvador7.3
20Austria280.070Guatemala6.9
21Belgium227.571Macedonia6.8
22Turkey6)198.172Tunisia6.7
23Algeria173.673Ireland6.0
24Philippines156.274Iraq5.9
25Thailand152.475Lithuania5.8
26Libya143.876Bahrain4.7
27Singapore127.477Tajikistan4.5
28Sweden125.778Mauritius3.9
29South Africa125.079Mongolia3.5
30BIS2)119.080Canada3.4
31Greece111.781Slovenia3.2
32Mexico105.882Aruba3.1
33Romania103.783Hungary3.1
34Poland102.984Kyrgyz Republic2.6
35Kazakhstan91.985Mozambique2.5
36Australia79.986Luxembourg2.2
37Kuwait79.087Suriname2.2
38Egypt75.688Hong Kong2.1
39Indonesia73.189Bosnia and Herzegovina2.0
40Denmark66.590Iceland2.0
41Pakistan64.491Papua New Guinea2.0
42Argentina54.792Trinidad and Tobago1.9
43Korea54.493Albania1.6
44Belarus4)49.694Yemen1.6
45Finland49.195Honduras0.7
46Bolivia42.396Paraguay0.7
47Bulgaria39.997Dominican Republic0.6
48WAEMU3)36.598Malawi0.4
49Malaysia36.499Mauritania0.4
50Peru34.7100Malta0.3

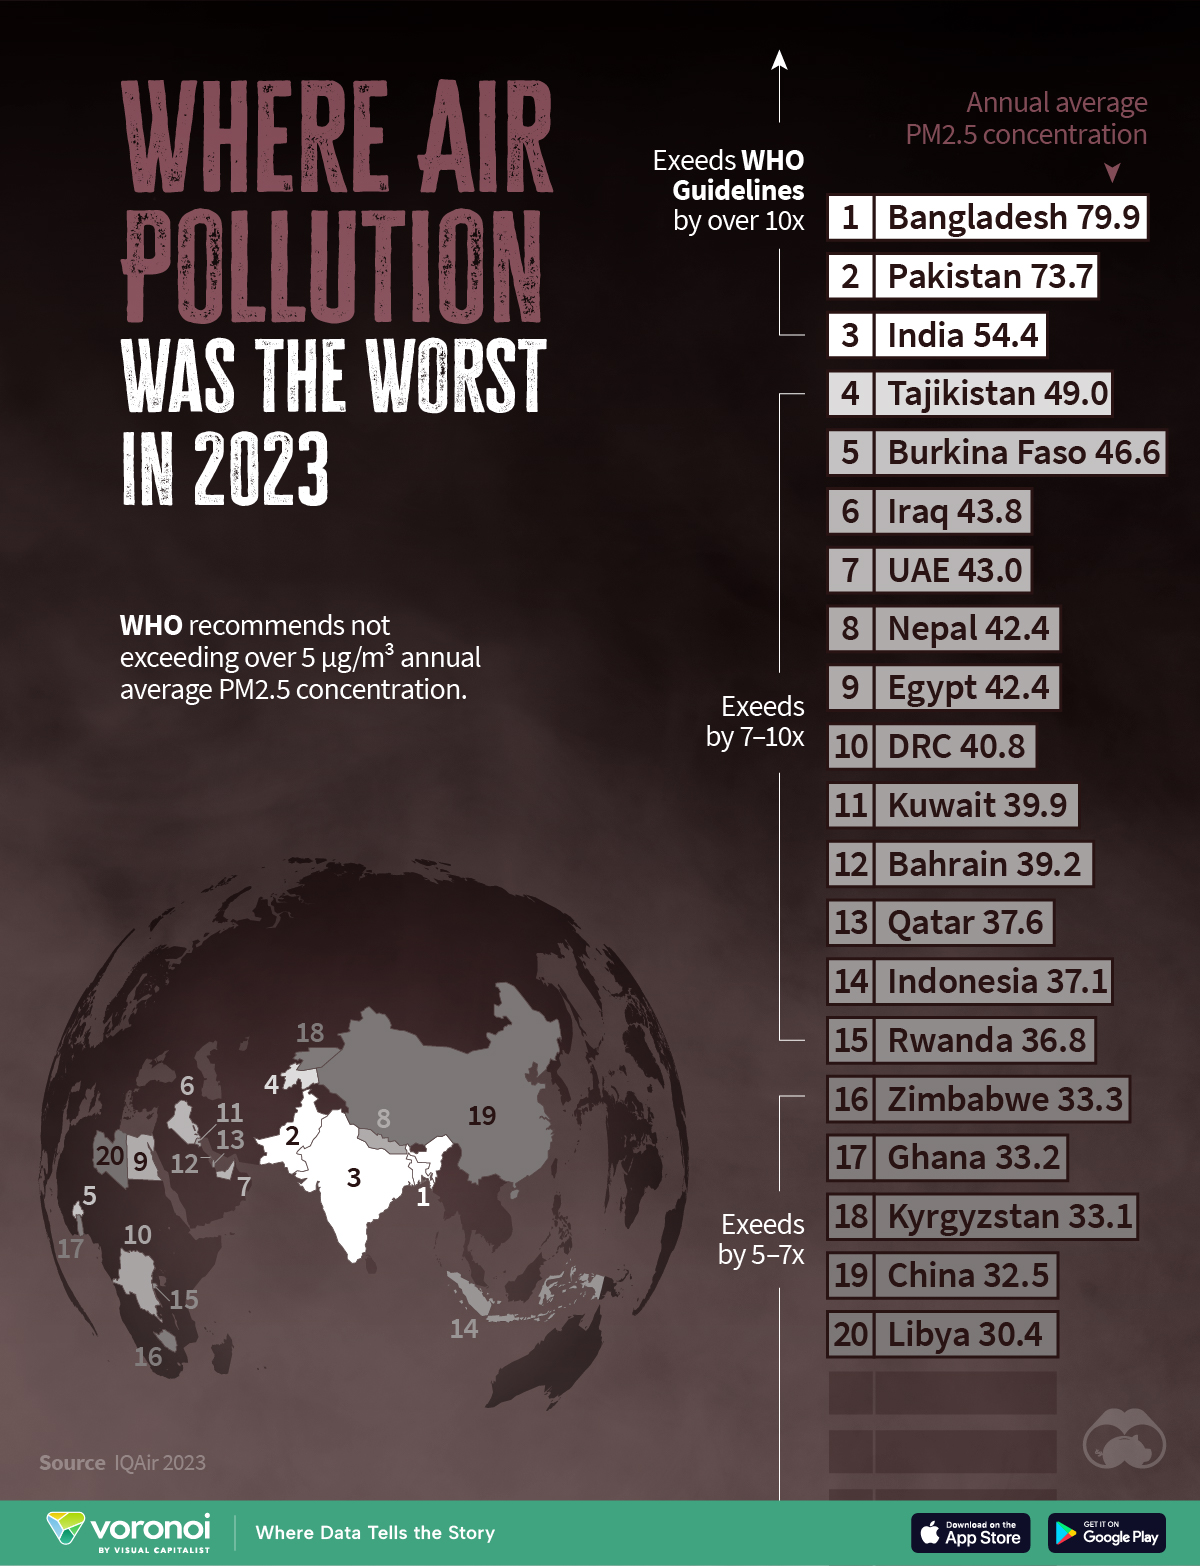
Países con mayor contaminación ambiental